













Key facts
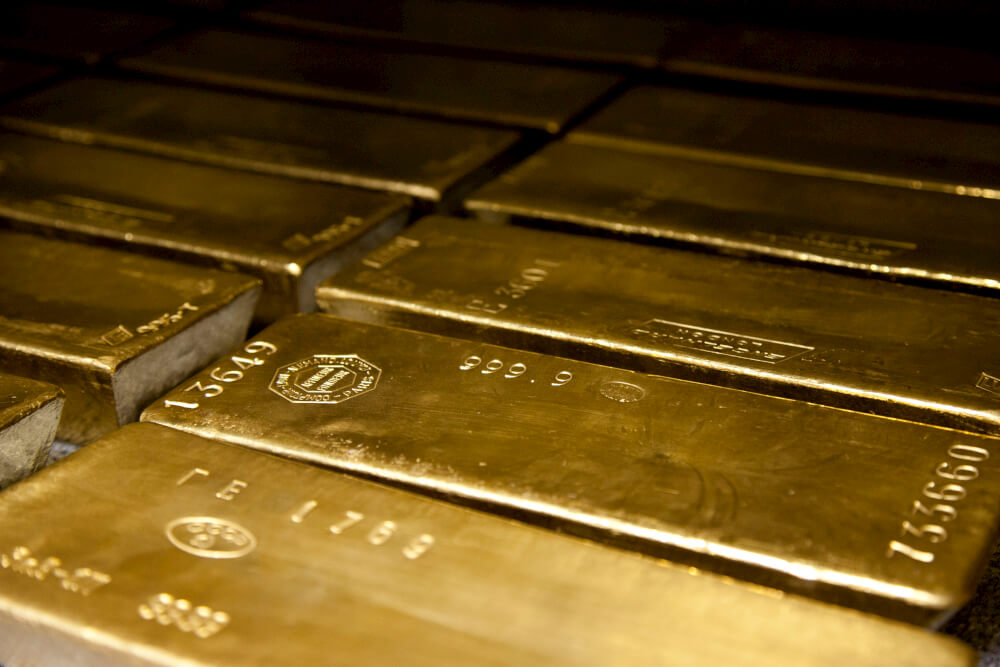
- Gold rose ~7% on the week to $4,340.70/oz — its strongest weekly showing since mid-January and a seven-week high.
- US nonfarm payrolls fell by 23,000 in July against expectations for an 80,000 gain, reshuffling Fed rate expectations.
- September Fed hike odds dropped to ~44%, down from 67% a week earlier, with the Fed on hold at 3.50%–3.75% after a 9–3 vote.
- All three major US indices posted their largest weekly gains since April, the Nasdaq leading at +5.19% and the S&P 500 setting a new all-time closing high.
- The Dollar Index fell to 99.539, down roughly 1.7% from 101.23 a month earlier.
- The 2-year yield dropped 4.2 bps to 4.245% and the 10-year fell 2 bps to 4.649%, steepening the 2–10s curve to about +45.2 bps.
- Wednesday’s July CPI is the week’s focal point, with consensus at 3.4% headline and 2.5% core.
August volatility
It is traditionally assumed that August is the quietest month for the markets. Volatility drops across all asset classes as fund managers and their clients go on vacation, so market moves are smaller and trading gets boring. However, this idea is a common market misconception. While trading volumes do tend to decline during August—particularly in Europe, where summer holidays thin out dealing desks—reduced liquidity can actually amplify rather than suppress volatility. Indeed, this very August illustrates the point: recent market data show the dollar index sliding to its lowest since mid-June after a surprise US jobs contraction, gold surging over 2% to a seven-week high, and oil prices whipsawing on Middle East tensions. It is true that trading desks are lighter staffed in August. But thinner order books mean that any catalyst, including a surprise data release, a geopolitical escalation, or a liquidity squeeze, can move prices further and faster. As financial market analysts at Elev8, note: ‘When a void opens up, something always rushes in to fill it. The market was always going to step up to solve its own problem, and we’re probably going to see a lot more turbulence because of it’. As of last Friday, the EURUSD implied volatility surface showed the market is not pricing in calm conditions. The EURUSD term structure shows at-the-money (ATM) implied volatilities ranging from ~4.9% at the overnight tenor to ~7.3% at 10 years, with a steadily upward-sloping curve, reflecting genuine uncertainty about the macro outlook rather than summer complacency. Far from being quiet, the past week has delivered some significant events:- US nonfarm payrolls fell by 23,000 in July versus expectations for an 80,000 gain, a significant miss that reshuffled Fed rate expectations.
- Equity markets posted their best weekly gain since May (MSCI All-World +2.4%).
- Gold rose ~7% in the week—its strongest weekly showing since mid-January.
- Oil volatility spiked on Strait of Hormuz tensions and Houthi attacks on Saudi Arabia.
- Fed rate uncertainty intensified, with markets split on whether rates rise next month.
Key Forex themes
Last Friday, the US Dollar Index (DXY) dropped to 99.539, down from 101.23 a month earlier, a decline of approximately 1.7% . The weak July payrolls report pushed Fed rate-hike expectations down to roughly 44%, from 67% a week ago. Table 1. Major Forex & macro asset snapshot (7 August 2026)| Asset | Close | 1-week Change | 1-month Change | Trend |
|---|---|---|---|---|
| DXY (Dollar Index) | 99.539 | -0.38% | -1.47% | ↓ Weakening |
| EURUSD | 1.1558 | +0.27% | +1.29% | ↑ Euro strength |
| USDJPY | 157.78 | +0.13% | -2.66% | ↓ Yen rally on intervention |
| GBPUSD | 1.3488 | 0.06% | 1.02% | → Range-bound, but above 1.3450 POV |
| Gold (XAUUSD) | 4,341 | +7.20% | +4.71% | ↑↑ Breakout to 7-week high |
| Bitcoin (BTCUSD) | 64,892 | +3.29% | +2.48% | → Range-bound, but above 64,000 POV |
US equity indices
All three major US indices posted their largest weekly gains since April. The S&P 500 reached a new all-time closing high, propelled by strong corporate earnings (85.1% beat rate) and a soft payrolls report that eased rate-hike fears. Table 2. US equity index performance (7 August 2026)| Index | Close | 1-Day | MTD | YTD |
|---|---|---|---|---|
| S&P 500 | 7,757.64 | +0.62% | +3.58% | +13.32% |
| Dow Jones | 54,036.93 | +0.28% | +2.96% | +12.43% |
| Nasdaq Composite | 26,690.62 | +1.30% | +5.19% | +14.84% |
Bond yields & inflation
Treasury yields fell sharply following the weak payrolls report. The 2-year yield dropped 4.2 basis points (bps) to 4.245%, while the 10-year yield fell 2 bps to 4.649%. The 2–10s curve steepened to approximately +45.2 bps. The 10-year yield had hit its highest level since January 2025 in late July but has since pulled back as oil prices retreated from a $102/bbl peak to roughly $83/bbl, alleviating inflation concerns. Table 3: U.S. Treasury Yields (7 August, 2026)| Tenor | Yield | Direction |
|---|---|---|
| 2-year | ~4.245 | ↓ -4.2 bps on the day |
| 10-year | ~4.649 | ↓ -2.0 bps on the day |
| 2–10 spread | ~+45.2 | Steepening |
Monetary Policy & Week Ahead
The Fed held rates at 3.50%–3.75% at its July meeting, with an unusually high level of dissent as 3 of 12 policymakers voted for a hike. Markets are pricing a ~44% probability of a September hike, down from 67% a week ago. Under Chair Kevin Warsh, the Fed has offered minimal forward guidance, amplifying the data-dependency of market moves. Table 4. Critical data this week (10–14 August)| Date | Event | Relevance |
|---|---|---|
| Monday, 10 August | NFIB Small Business Optimism | Business sentiment gauge |
| Wednesday, 12 August | July CPI (consensus: 3.4% YoY headline; 2.5% core); Treasury budget statement | The single most important data point for the Fed decision |
| Thursday, 13 August | July PPI; Weekly jobless claims; Fed speakers Hammack & Barkin | Producer price inflation complements the CPI picture |
| Friday, 14 August | Retail sales; Univ. of Michigan consumer sentiment; Business inventories | Consumer spending and confidence check |
| Central bank | Latest rate | Last action | Next meeting |
|---|---|---|---|
| US Federal | 3.50–3.75% | Hold (9–3 vote) | 15–16 September |
| European Central Bank | 2.25% | Hold (after June hike) | 9–10 September |
| Bank of Japan | < 1% | Hold | 17–18 September |
| Bank of England | 3.75% | Hold (3–0–6 vote) | 16–17 September |
| Reserve Bank of Australia | 4.35% | Hold | 10–11 August |
Key risks & themes to watch
- Inflation data (Wednesday, 12 August). A hot CPI print could reverse the week’s risk-on momentum and push the probability of a September Fed hike back above 50%.
- Yen intervention follow-through. Japanese finance minister Satsuki Katayama stated Japan and the US ‘stand ready to intervene in Forex markets again if needed’, adding an asymmetric risk to USDJPY shorts.
- Middle East/oil volatility. Brent crude pulled back from $102 to ~USD 83/bbl, but Houthi attacks and Strait of Hormuz risks remain a wildcard for energy prices and, by extension, inflation.
- Earnings tail (tech focus). Applied Materials, Cisco, and CoreWeave report next week, with semiconductor stocks remaining volatile despite strong AI-driven demand.
- Speculative positioning. CFTC data showed yen and euro net-short positions were sharply reduced, with JPY net shorts falling to -45,473 contracts from -163,412 the prior week, reflecting the intervention-driven unwind.
- CPI in-line/soft. A core reading at or below 2.5% confirms easing price pressures, fueling further upside for Gold toward the $4,530 area.
- CPI hotter than expected. A core print above 2.6% reignites hawkish Fed expectations, triggering a corrective retracement back toward $4,200–$4,100 as real yields rebound.
- Mixed CPI. Discrepancies between headline and core numbers will create volatile two-way trading before the market settles behind the core trend.
- Where to buy: maintain a bullish bias on dips above $4,280, with upside expansion targeting $4,500 and $4,530.
- Where to sell: tactical shorts are favoured on a hot inflation print that forces a breakdown below $4,280, targeting $4,170 and $4,120.
Frequently asked questions
Why did gold rise so much this week? Gold posted its best week since mid-January, closing at $4,341 for a 7.20% weekly gain and a seven-week high. Elev8 attributes the move to the weakening dollar and geopolitical uncertainty around the Middle East, with the Dollar Index falling to 99.539. Is August really a quiet month for markets? No. Trading volumes do decline, particularly in Europe, but reduced liquidity can amplify rather than suppress volatility. Thinner order books mean any catalyst — a surprise data release, a geopolitical escalation or a liquidity squeeze — can move prices further and faster. What did the July US jobs report show? Nonfarm payrolls fell by 23,000 in July against expectations for an 80,000 gain. The miss pushed Fed rate-hike expectations down to roughly 44% from 67% a week earlier and sent Treasury yields lower across the curve. What are the key levels for gold ahead of CPI? Elev8 sees a bullish bias on dips above $4,280, with upside expansion targeting $4,500 and $4,530. Tactical shorts are favoured on a hot inflation print that forces a breakdown below $4,280, targeting $4,170 and $4,120. When is the next Fed meeting and what are markets pricing? The Federal Reserve next meets on 15–16 September. It held at 3.50%–3.75% in July on a 9–3 vote, and markets are pricing roughly a 44% probability of a September hike, down from 67% a week ago. Which US index led the rally? The Nasdaq Composite, with a +5.19% monthly-to-date gain and a close of 26,690.62. All three major US indices posted their largest weekly gains since April, and the S&P 500 reached a new all-time closing high.